1
2
3
4
5
6
7
8
9
10
11
12
13
14
15
16
17
18
19
20
21
22
23
24
25
26
27
28
29
30
31
32
33
34
35
36
37
38
39
40
41
42
43
44
45
46
47
48
49
50
51
52
53
54
55
56
57
58
59
60
61
62
63
64
65
66
67
68
69
70
71
72
73
74
75
76
77
78
79
80
81
82
83
84
85
86
87
88
89
90
91
92
93
94
95
96
97
98
99
100
101
102
103
104
105
106
107
108
109
110
111
112
113
114
115
116
| import matplotlib.pyplot as plt
import matplotlib.patches as patches
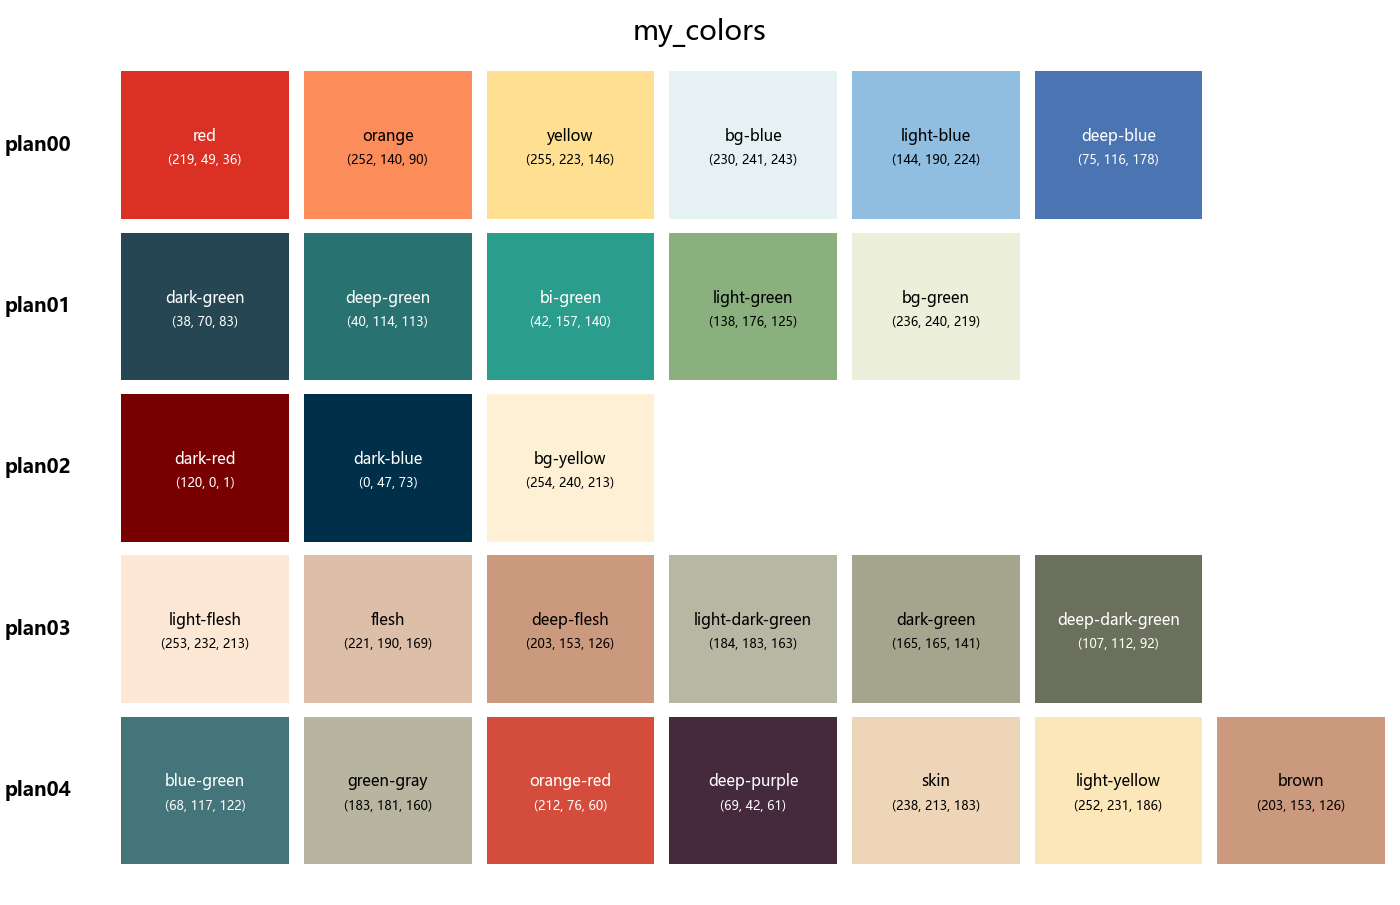
colors = {
'plan00': [
{'name': 'red', 'rgb': [219, 49, 36]},
{'name': 'orange', 'rgb': [252, 140, 90]},
{'name': 'yellow', 'rgb': [255, 223, 146]},
{'name': 'bg-blue', 'rgb': [230, 241, 243]},
{'name': 'light-blue', 'rgb': [144, 190, 224]},
{'name': 'deep-blue', 'rgb': [75, 116, 178]},
],
'plan01': [
{'name': 'dark-green', 'rgb': [38, 70, 83]},
{'name': 'deep-green', 'rgb': [40, 114, 113]},
{'name': 'bi-green', 'rgb': [42, 157, 140]},
{'name': 'light-green', 'rgb': [138, 176, 125]},
{'name': 'bg-green', 'rgb': [236, 240, 219]},
],
'plan02': [
{'name': 'dark-red', 'rgb': [120, 0, 1]},
{'name': 'dark-blue', 'rgb': [0, 47, 73]},
{'name': 'bg-yellow', 'rgb': [254, 240, 213]},
],
'plan03': [
{'name': 'light-flesh', 'rgb': [253, 232, 213]},
{'name': 'flesh', 'rgb':[221, 190, 169]},
{'name': 'deep-flesh', 'rgb': [203, 153, 126]},
{'name': 'light-dark-green', 'rgb': [184, 183, 163]},
{'name': 'dark-green', 'rgb': [165, 165, 141]},
{'name': 'deep-dark-green', 'rgb': [107, 112, 92]},
],
'plan04': [
{'name': 'blue-green', 'rgb': [68, 117, 122]},
{'name': 'green-gray', 'rgb': [183, 181, 160]},
{'name': 'orange-red', 'rgb': [212, 76, 60]},
{'name': 'deep-purple', 'rgb': [69, 42, 61]},
{'name': 'skin', 'rgb': [238, 213, 183]},
{'name': 'light-yellow', 'rgb': [252, 231, 186]},
{'name': 'brown', 'rgb': [203, 153, 126]},
]
}
def my_colors(palettes):
"""
Args:
palettes (dict): 包含颜色方案的字典。
"""
plt.rcParams['font.sans-serif'] = ['Microsoft YaHei', 'Arial']
plt.rcParams['axes.unicode_minus'] = False
max_cols = 7
num_plans = len(palettes)
fig, axes = plt.subplots(
nrows=num_plans,
ncols=max_cols,
figsize=(max_cols * 2, num_plans * 2),
squeeze=False
)
fig.suptitle('my_colors', fontsize=20, y=0.98)
for i, (plan_name, colors_list) in enumerate(palettes.items()):
axes[i, 0].text(-0.3, 0.5, plan_name, transform=axes[i, 0].transAxes,
fontsize=14, fontweight='bold', ha='right', va='center')
for j, color_info in enumerate(colors_list):
if j >= max_cols:
print(f"警告:'{plan_name}' 中的颜色数量超过 {max_cols},多余的颜色将不会显示。")
break
ax = axes[i, j]
rgb_255 = color_info['rgb']
name = color_info['name']
rgb_norm = [c / 255.0 for c in rgb_255]
ax.set_facecolor(rgb_norm)
luminance = (0.299 * rgb_norm[0] + 0.587 * rgb_norm[1] + 0.114 * rgb_norm[2])
text_color = 'white' if luminance < 0.5 else 'black'
ax.text(0.5, 0.5, name, ha='center', va='bottom', fontsize=11, color=text_color)
ax.text(0.5, 0.35, f'({rgb_255[0]}, {rgb_255[1]}, {rgb_255[2]})',
ha='center', va='bottom', fontsize=9, color=text_color)
ax.set_xticks([])
ax.set_yticks([])
ax.spines['top'].set_visible(False)
ax.spines['right'].set_visible(False)
ax.spines['bottom'].set_visible(False)
ax.spines['left'].set_visible(False)
for i in range(num_plans):
num_colors_in_plan = len(palettes[list(palettes.keys())[i]])
for j in range(num_colors_in_plan, max_cols):
axes[i, j].axis('off')
plt.tight_layout(rect=[0, 0.03, 1, 0.98])
plt.show()
if __name__ == '__main__':
print("正在直接运行 my_colors.py 以展示颜色库...")
my_colors(colors)
|